№ 0039GitHub
Muse Glimmer vs Qwen local agent benchmark
A controlled local benchmark on an M1 Max comparing Muse Glimmer 30B with Qwen 3.6 35B and Qwen 3.8 27B on tool calling and data-science tasks; Glimmer passed 24/30 versus Qwen 3.8's 30/30.
rickyzzzzz/muse-glimmer-benchmarkREADME ↗
Muse Glimmer 30B vs Qwen 3.6 35B vs Qwen 3.8 27B — Local Agent-Task Benchmark
A controlled comparison of Meta's Muse Glimmer 30B, Alibaba's Qwen 3.6 35B, and Qwen 3.8 27B on real agentic workloads — tool calling, multi-step tool chains, failure recovery, code generation, and instruction following — all running locally on the same Apple M1 Max (64 GB) via Ollama's MLX engine.
TLDR
- On the expanded 30-task suite (12 core agentic + 18 data-science workload tests): Qwen 3.8 27B passed 30/30 (100%); Muse Glimmer 30B passed 24/30 (80%).
- Qwen 3.8 is 2.1× faster overall (889.9s vs 1847.4s total; per-task avg 29.7s vs 61.6s).
- The decisive difference is the DS workload: on 18 data-science tasks (pandas/SQL coding, A/B experimentation, causal inference), Qwen 3.8 passed 18/18 (100%); Glimmer passed 12/18 (67%) — failing 4 tasks by tool-looping past its turn budget (
max_turns_exceeded) and 2 by returning empty output. - On the original 12 core agentic tasks, all three models are close: Glimmer 12/12, Qwen 3.6 11/12 (shortcut a tool step), Qwen 3.8 12/12.
- Why the speed gap — the key architectural factor: Glimmer is a dense model (~32.3B params, all active per token); Qwen 3.6 35B is a Mixture-of-Experts (MoE) model (~35B total, only ~3B active per token); Qwen 3.8 27B is dense (~27.8B params, all active) — yet still ~2× faster than Glimmer.
- Recommendation: Qwen 3.8 27B is the clear best local agent model for data-science workloads — perfect tool-use fidelity, no tool-looping, and 2× the speed.
| Metric | Muse Glimmer 30B | Qwen 3.6 35B | Qwen 3.8 27B |
|---|---|---|---|
| Core 12 tasks | 12/12 (100%) | 11/12 (92%) | 12/12 (100%) |
| Full 30 tasks | 24/30 (80%) | — | 30/30 (100%) |
| DS workload (18) | 12/18 (67%) | — | 18/18 (100%) |
| Total time (30) | 1847.4s | — | 889.9s (2.1× faster) |
| Architecture | Dense | MoE | Dense |
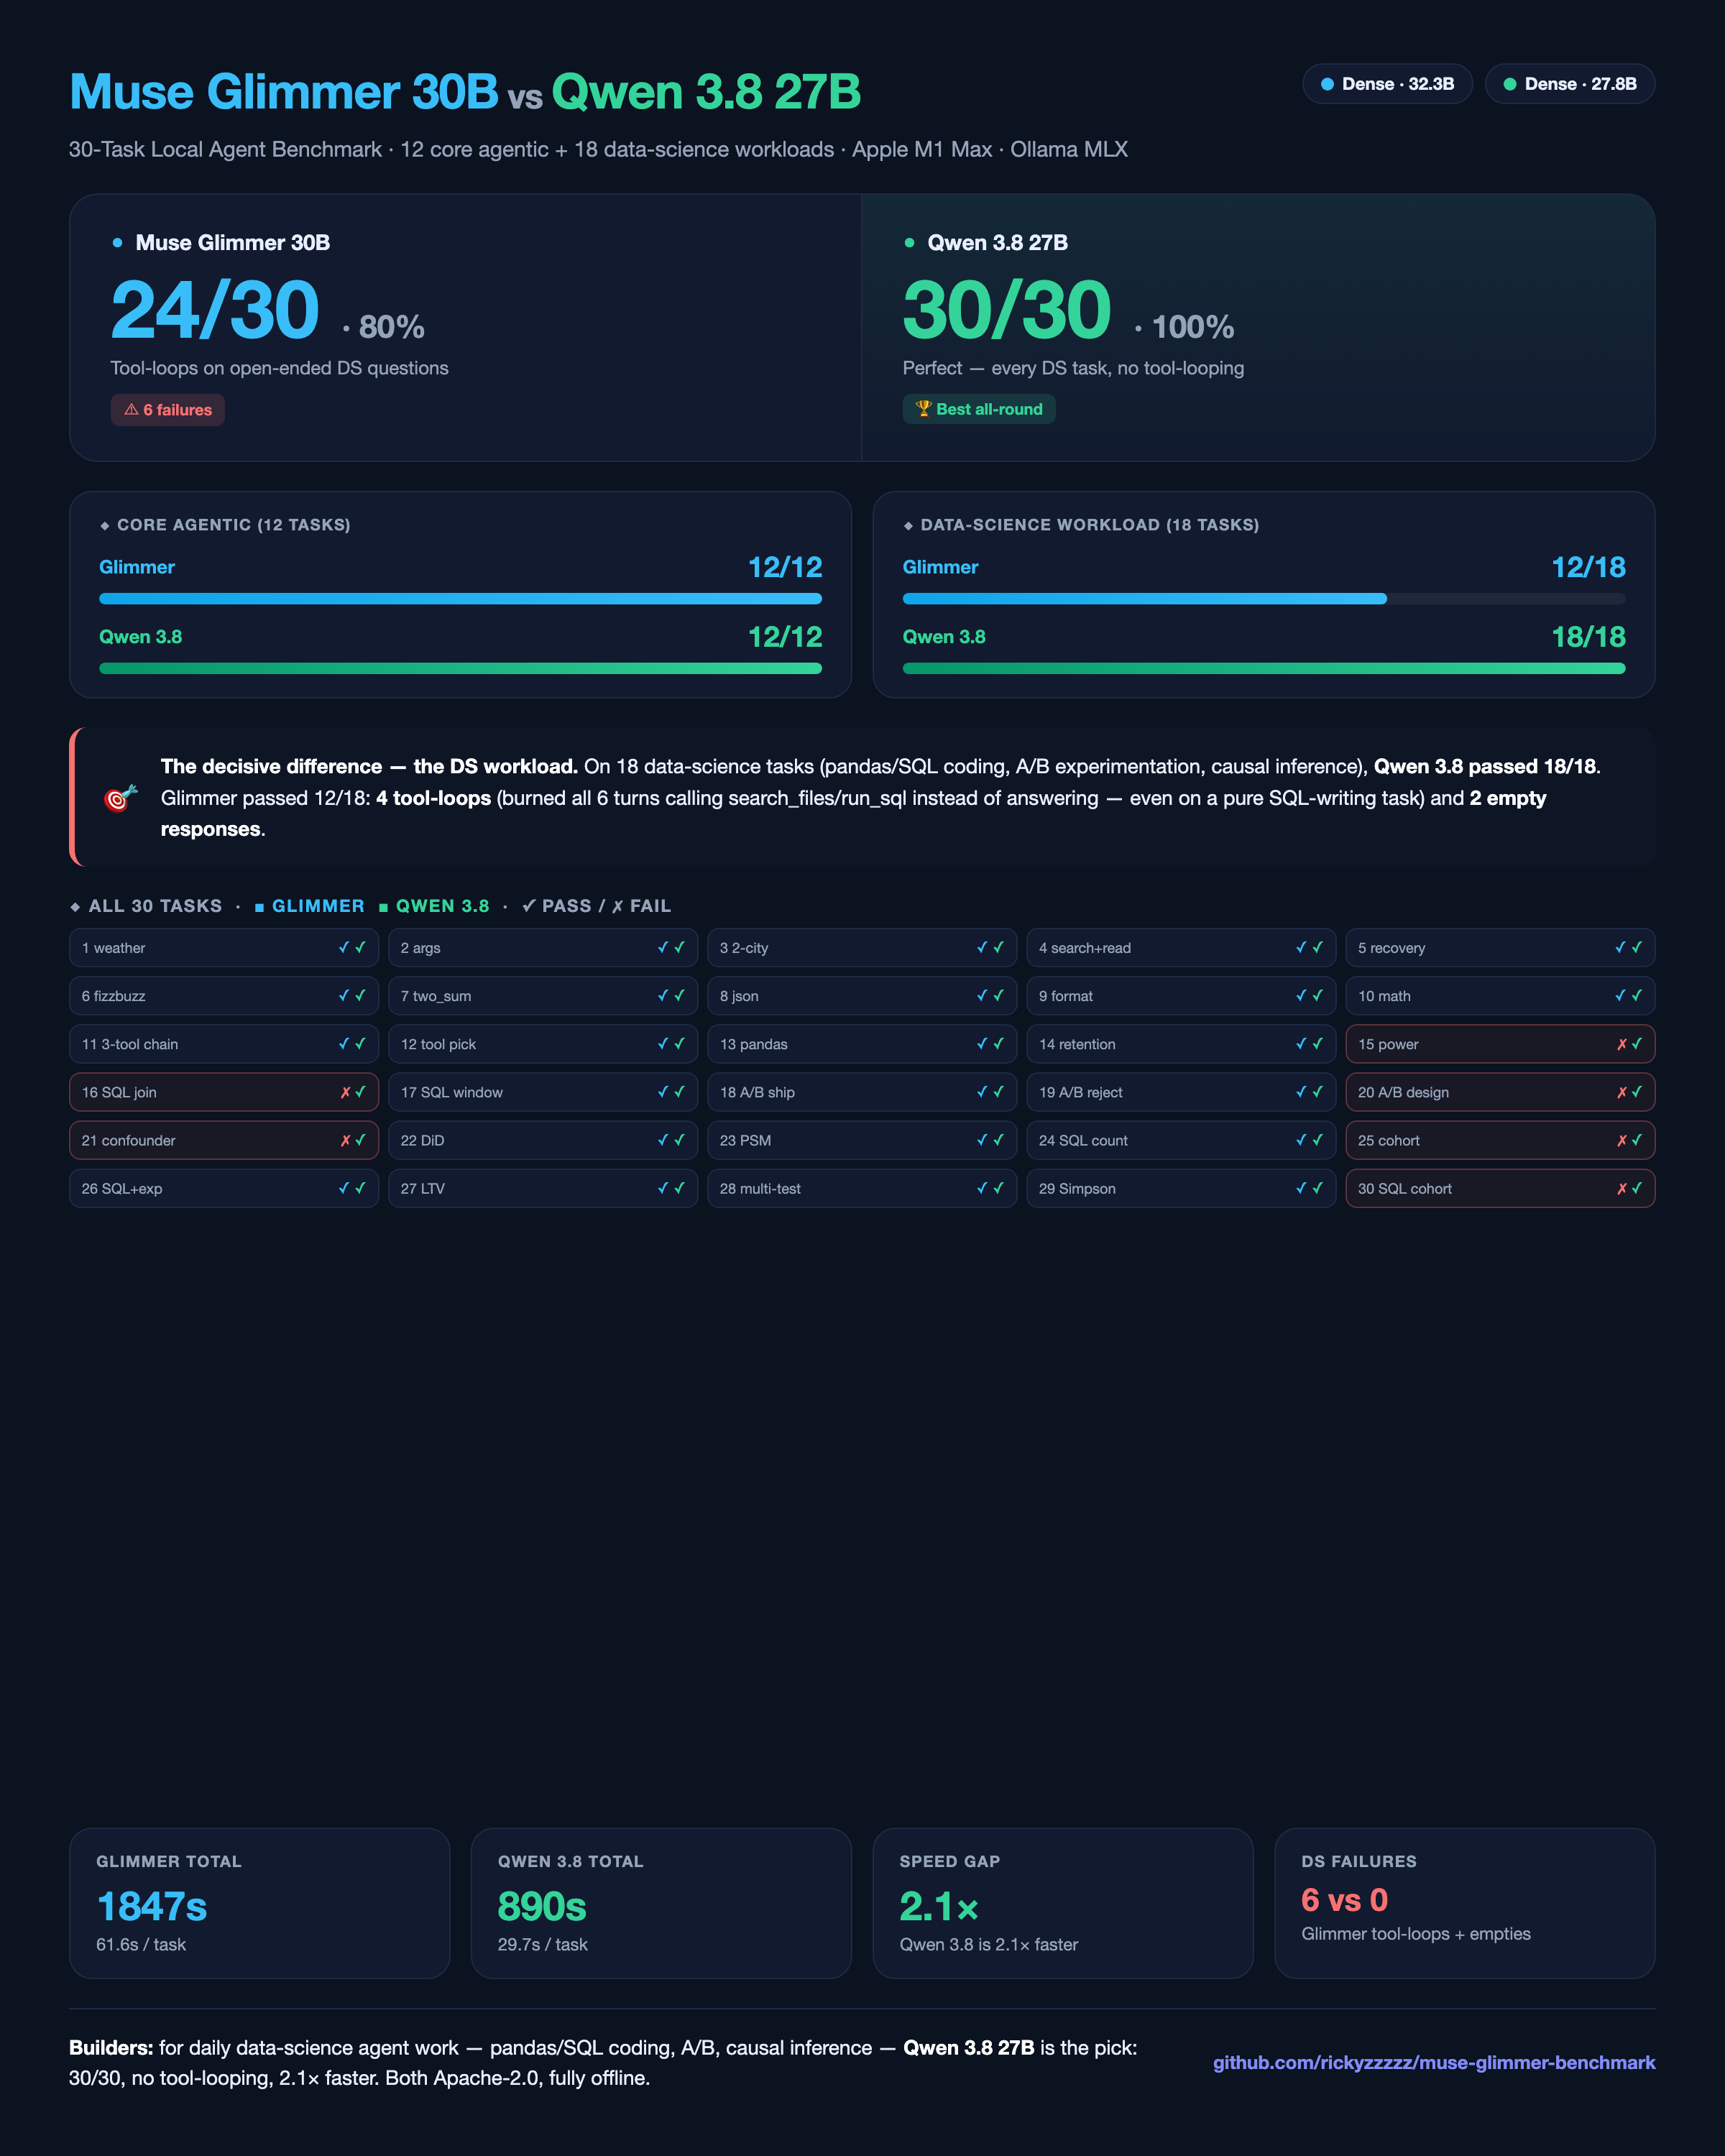
Table of Contents
- Background & Motivation
- Models Under Test
- Benchmark Design
- Results
- Analysis: Why the Difference?
- Caveats & Methodology Notes
- [Conclusions & Recommendations](#conclusions